


Tarachand Infralogistic Solutions
Company Overview
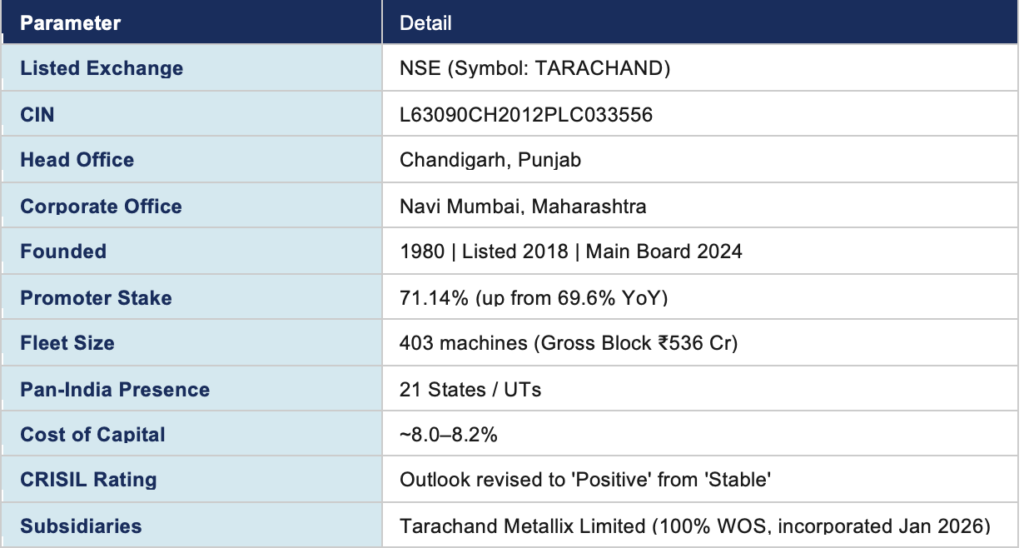
Tara Chand Infralogistic Solutions Limited (NSE: TARACHAND) is one of India’s leading providers of integrated infrastructure-logistics services. Founded in 1980 as a steel trading company in Jalandhar, Punjab, the company has evolved over four decades into a full-service infra-logistic solutions provider. It was listed on NSE Emerge in March 2018 and migrated to the NSE Main Board in April 2024.
The company operates across 21 states and union territories through a fleet of 403 owned machines with a gross block of ₹536 crore (as of December 2025). It serves marquee clients including Reliance Industries, Tata Steel, SAIL, ONGC, NTPC, BHEL, Adani, JSW Energy, Vedanta, and L&T, among others.
Business Segments and How the Company Makes Money
Tara Chand operates through three distinct business segments, each with different revenue and margin profiles. The company deliberately de-emphasises low-margin segments in favour of profitable growth — a philosophy clearly articulated in every quarterly call.
Segment A: Equipment Rentals & Infrastructure Works (~55–58% of Revenue)
This is the highest-margin, most capital-intensive, and the primary growth engine of the company. The company owns a fleet of large cranes (50–900 MT), hydraulic piling rigs, aerial platforms, and specialised heavy equipment, which it rents to clients across metals & minerals, cement, renewable energy, oil & gas, railways, and urban infrastructure.
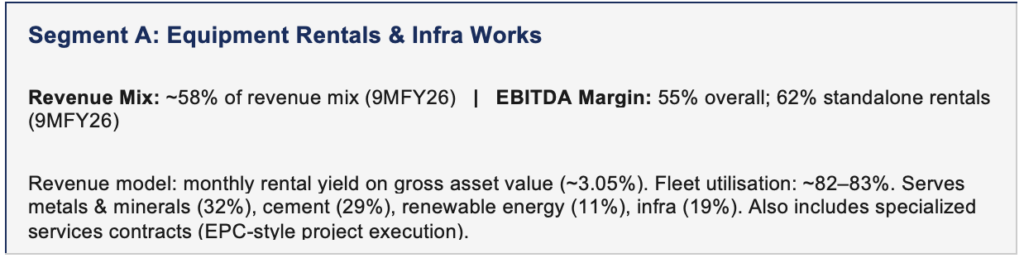
Revenue Model — Equipment Rentals
The core economics are straightforward: Tara Chand acquires heavy equipment (sourced from China — SANY, XCMG, Zoomlion), deploys it to blue-chip industrial clients under 1–2 year rental contracts, and earns a gross monthly rental yield of ~3.05% on the asset’s cost. At 82–83% utilisation on a ₹536 crore gross block, the annualised rental revenue potential exceeds ₹130–140 crore from the equipment rental segment alone.
The company has consciously focused on large-tonnage cranes (now up to 900 MT — the largest in its fleet) and specialised equipment to differentiate from commodity crane-hire operators and protect yields. Higher-capacity machines do see slightly lower yields per rupee of cost, but the premium clients they attract and the multi-quarter contracts they support offset this.
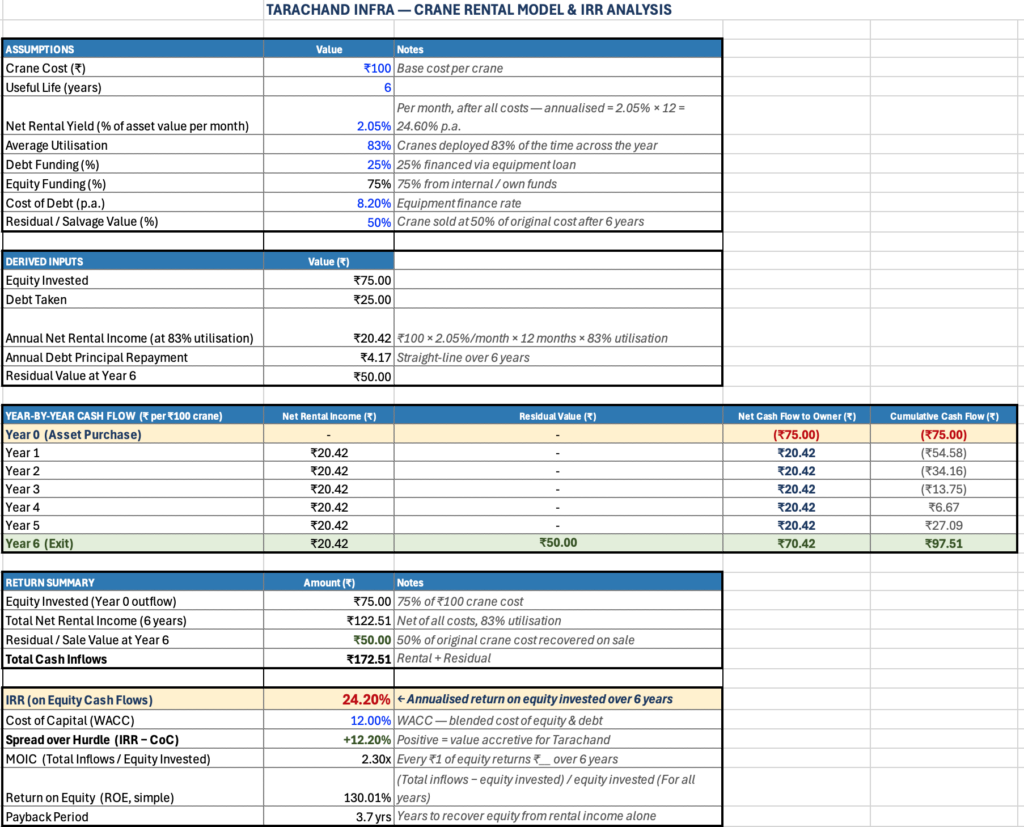
How Rental Works?
- Consider Tarachand Purchases 1 crane for ₹100, of this 25% of this is funded by debt
- Cranes are deployed at various customer sites, and tarachand earns 2.05% as Net Rental Yield(Net – After all costs),i.e – on ₹100, rental yield is ₹20.42.
- The useful life of these cranes are 6 years, post which the crane is sold for 50% of its origin investment, in this case ₹50
- After the end of 6 years, the crane has created an IRR of 24.2%, Cost of capital is 12%, hence a clear spread of 10%
Excel sheet snapshot to show the above
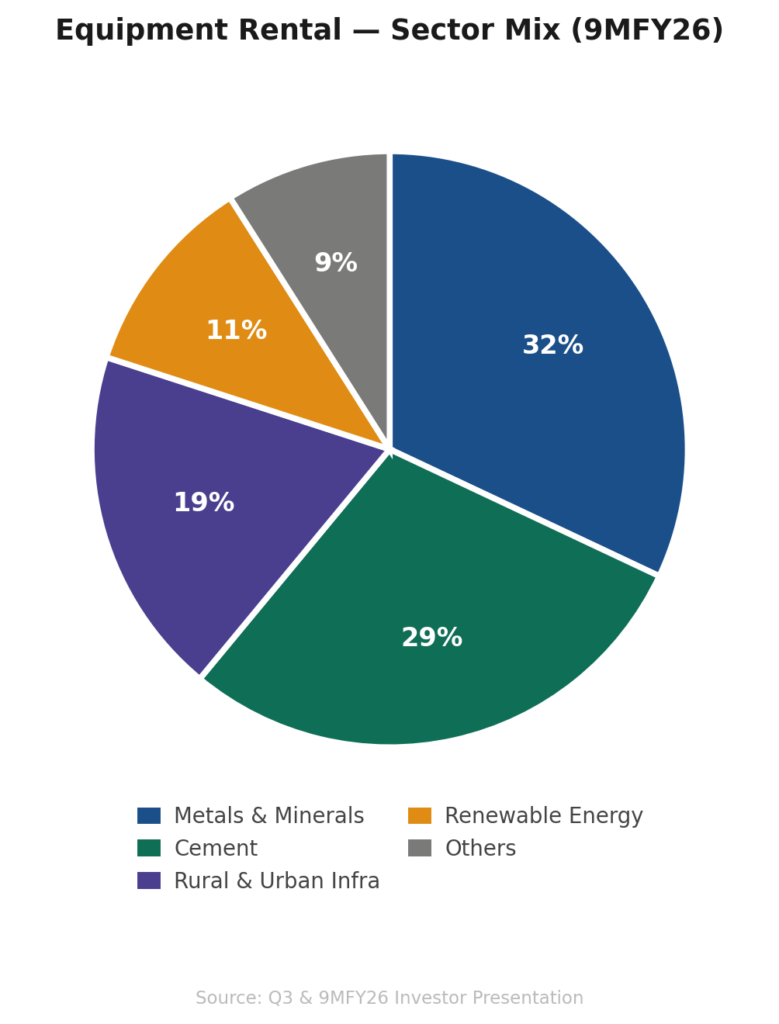
Sector Mix for Equipment rental
Competitive Advantage
- Scale of Operations – Any company in the Equipment Rental space, needs to have a large fleet size, with varied types of Cranes and varied types of Cranes with different lifting capacities.
- Rental with a service – Crane rentals are not pure product rentals, there is a major element of Service. Crane lifting needs a team to finish a job, this isn’t easy to create. Lot of experienced people are required in this to be able to complete any work. These kind of teams are built over time
- Certified, experienced crane operators (scarce in India)
- Engineering teams to plan lifts (load calculations, rigging design)
- In-house transport capability to move the crane between sites
- Maintenance teams familiar with the specific equipment
- Diversified End user industry – Having a diversified end user industry is one of the most important tool, not only to manage risk, but to be able to have higher capacity utilisation. A single industry goes through cycles, to be able to bare this, having a wide range of industry helps to grow consistently.
- Pan India Presence – When a contract ends at one site, Tara Chand can redeploy that crane to another state where demand exists — rather than leaving it idle. A regional operator with equipment only in, say, Punjab, has far fewer options when local demand dips. This directly protects utilisation rates (currently 82–83%), which is the most critical operating metric in this business.
- Specialised Equipment Capability (900 MT Crane, RTG Cranes) – If not the most important in-terms of competitive advantage. Having Higher lifting capacities is a big advantage, provided Crane rental companies are able to adhere to specific projects and industries. A single 900MT crane is 15-20crs. For a regional operator, an upfront payment of 15-20crs isn’t always easy.
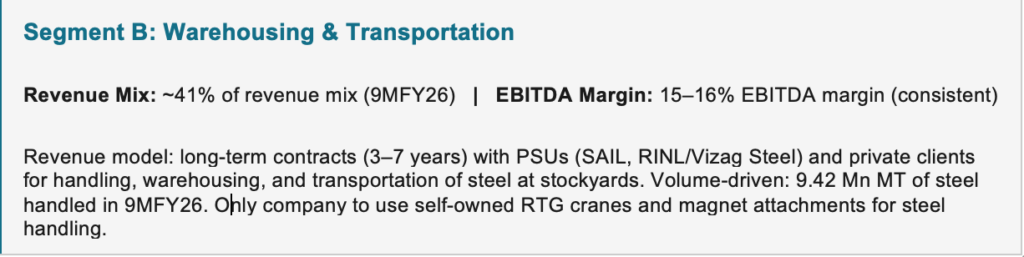
Segment B: Steel Warehousing & Transportation (~41–45% of Revenue)
This segment provides steady, recurring revenue anchored by long-duration contracts. Key examples include a consignment agency contract with SAIL (₹81.51 crore order, Bangalore stockyard, 4.5-year tenure) and transportation services for RINL (₹27.65 crore).
At its core, Tara Chand acts as an outsourced logistics arm for large steel producers — primarily PSUs like SAIL and RINL (Vizag Steel). Steel producers manufacture steel at their plants but need it stored, handled, and distributed to customers across India. They do not want to manage this logistics infrastructure themselves. Tara Chand does it for them.Think of it as facility management + material handling + distribution, all bundled under one long-term contract.
This segments gives tarachand visibility of steady revenues. These are long term contract, which ensure capacity is utilised for a long period, at the same time give visibility to get new orders in time.
One major advantage Tarachand has is, they have their own Rubber tyre gantries. They are the only company to have their own RTG (Management Claim)
Segment C: Steel Processing & Distribution (Negligible, ~1–2% of Revenue)
This is a horizontal integration of the steel logistics business — providing cut-to-size steel products to existing clients. The company is consciously winding this down, as margins have deteriorated from 16% (FY22) to 4% (FY25). Revenue has been flat to declining. It exists today purely as a client service add-on, not as a standalone growth driver.
Business Economics & Key Operating Metrics
1. Capex-Driven Growth Model
This is fundamentally a capex-to-revenue conversion business. The company invests in owned equipment (100% owned — no third-party assets), and every rupee deployed translates directly into rental revenue at a yield of ~3% per month. The key drivers of earnings growth are: (a) quantum of capex deployed, (b) speed of equipment induction and deployment, and (c) utilisation rate.
| Year | Capex (₹ CR) | Fleet Additions |
| FY22 | 16.1 | Base |
| FY23 | 48.5 | +50 |
| FY24 | 69.1 | +12 |
| FY25 | 1,45.0 | +56 |
| 9MFY26 | 1,21.3 | +35 |
The company has historically guided ₹100 crore capex for FY26 but executed ₹121.34 crore by December 2025 — demonstrating an opportunistic approach to capital deployment when market demand supports it. For FY27, preliminary guidance is ₹60–70 crore, reflecting the high base already established.
2. Why EBITDA Margins Are High — and Why Cash PAT is the Better Metric
The Equipment Rental segment earns 59–62% EBITDA standalone because, once equipment is deployed on multi-month contracts, the incremental operating cost is low (maintenance, fuel, operator) relative to the high rental income. Depreciation is heavy (assets are depreciated over useful life), which suppresses reported PAT margins (7.5–8% in Q3FY26). Management rightly emphasises Cash PAT (PAT + Depreciation) as the truer cash earnings measure.
3. The Rental Yield Model
The central unit economic is the gross monthly rental yield: rental revenue earned per month as a percentage of the asset’s gross cost. At 3.05%, this is management’s stated industry-best benchmark and the number they track most closely.
| KPI | FY26 9M Level | Management Target |
| Avg. Gross Monthly Rental Yield | 3.05% | Sustain ≥3.0% |
| Fleet Utilisation | ~82% | 86–87% in Q4FY26 |
| Total Fleet Size | 403 machines | Grows with capex |
| Gross Block | ₹536 Cr (Dec-25) | Compounds with capex |
| Receivable Days | ~90 days (Q3) | Target <80 days |
| Net Debt / Equity | 0.8x | Target <1.0x |
| EBITDA Margin (Overall) | 37–38% | Sustain / improve |
| Equipment Rental EBITDA (standalone) | 59% (Q3) / 62% (9M) | Sustain |
| Warehousing EBITDA Margin | 15–16% | Sustain at 16% |
4. Debt Management
The company finances equipment purchase through a combination of term loans and supplier credit from OEMs. It targets net debt-to-equity below 1.0x (currently at 0.8x), with secured term loans of ₹114.9 crore as of December 2025. Cost of debt is ~8.0–8.2%. The business generates strong operating cash flows (₹44 crore for H1FY26) which fund a portion of capex, reducing net equity dilution required. The management is comfortable to maintain the Debt/Equity ratio below 1x.
5. Cast Flow from Operations – Tara Chand’s business model is a cash generation machine. Because the primary cost of running a deployed crane is depreciation which is non-cash, hence reported PAT significantly understates the true cash earnings. Every rupee of EBITDA above interest payments converts almost entirely into operating cash flow. This is why the company has consistently generated strong and growing cash from operations even while aggressively expanding its fleet.
| Particulars (₹ Cr) | FY22 | FY23 | FY24 | FY25 | H1FY26 |
|---|---|---|---|---|---|
| Net Profit (PAT) | 2.4 | 9.4 | 16.1 | 24.9 | 18.6 |
| Cash from Operations (CFO) | 27.0 | 42.4 | 46.2 | 56.2 | 47.5 |
| CFO / PAT (x) | 11.3x | 4.5x | 2.9x | 2.3x | 2.6x |
Growth Strategy and Outlook
- Revenue Guidance – Management has consistently guided 20–25% annual revenue growth over the next three years, with EBITDA margins sustaining at 37–38%. The company’s target for Q4 FY26 is a historic milestone: ₹100 crore+ quarterly revenue — its first ever — implying approximately ₹300 crore for FY26 full year. FY27 guidance on capex is ₹60–70 crore, a step-down from the peak of ₹145 crore (FY25) and ₹121 crore (9MFY26).
- Fleet Expansion – The company has added 35 machines in 9MFY26, including its largest-ever crane at 900 MT (an all-terrain crane) and two 800 MT crawler cranes. The focus is on large-tonnage, specialised equipment that can service renewable energy, petrochemical, and industrial turnaround contracts, segments with high barriers to entry and lower price competition.
- Sector Mix Shift – Renewable energy has grown from 5% of equipment rental revenues (FY25) to 11% (9MFY26) and is on track to exceed 10% for the full year. The company is growing in wind turbine erection (WTG contracts, e.g., ₹24.14 crore from JSW Energy) and solar/power plant construction. This is a structurally growing demand driver given India’s ambitious renewable energy targets.
Investment Thesis
- Riding India’s Structural Capex Supercycle –
- India is in the middle of a multi-decade infrastructure and industrial growth. The tailwinds are not cyclical — they are structural and policy-driven.
- Steel: India is targeting 300 Mn MT of steel capacity by 2030 vs. ~160 Mn MT today. Every new steel plant, expansion, and modernisation project requires heavy lifting equipment and steel logistics infrastructure. Tara Chand sits directly in the path of this growth.
- Renewable Energy: India’s 500 GW renewable target by 2030 requires thousands of wind turbines to be erected, each requiring 800–900 MT cranes. Tara Chand has already grown renewable energy from 5% to 11% of equipment rental revenues in one year. This is still early innings.
- Industrial Capex: Refineries, cement plants, petrochemical complexes, India’s private sector capex recovery is well underway. Reliance’s Green Energy Giga Complex at Jamnagar alone represents years of work for heavy crane operators.
- A Business Model With Exceptional Economics
- 62% standalone EBITDA on equipment rentals. It reflects the fundamental economics of the model, once a crane is deployed on a 12–18 month contract, the incremental cost of earning that rental income is low. There is no raw material cost, no inventory risk, no working capital cycle in the traditional sense.
- Reported PAT of 7–8% understates true earnings because depreciation is heavy (₹42 crore in Q3 alone). Cash PAT of ₹21 crore in Q3 FY26 — growing 22% YoY — is the number that matters. On a trailing 12-month basis, Cash PAT is tracking towards ₹80–85 crore for FY26.
- 3.05% monthly yield on ₹536 crore gross block = ~₹16 crore of rental revenue per month from the equipment alone. This is largely contracted, recurring, and visible. It is not dependent on winning new business every quarter.
- Multiple Growth Levers – Fleet expansion, utilisation improvement, specialized services scaling, new warehousing contracts, sector mix shift towards renewables, and Tarachand Metallix as a long-term optionality — all running simultaneously. Most smallcaps have one growth driver. Tara Chand has six.
- Order book -As of January 2026, the executable order book for FY26 stood at ₹96.90 crore (up 32% from ₹73.3 crore in January 2025), fully executable within Q4 FY26. The composition is 66% equipment hiring & projects and 34% warehousing & transportation. The company also maintains a larger order book for future periods (not disclosed separately), providing multi-quarter visibility.
- Operating Leverage – The business has structural operating leverage: fixed costs are largely sunk at the point of equipment purchase, so every incremental rupee of rental income from higher utilisation or fleet expansion flows through at disproportionately high margins — evidenced by EBITDA margins expanding 1,300 bps from 24.9% to 37.9% over four years on doubling revenue.
Management
The company is promoter-led with the founding Aggarwal family holding 71.14% stake (up from 69.6% a year prior — reflecting ongoing insider buying, a positive signal). The management team is:
| Name | Role & Background |
| Vinay Kumar Aggarwal | Chairman & Managing Director. First-generation entrepreneur, with the company since inception (1980). Instrumental in steel logistics innovation. |
| Ajay Kumar | Whole-Time Director. 30 years of industry experience. Manages client relationships and financial discipline. |
| Himanshu Aggarwal | Whole-Time Director & CFO. Joined Nov 2017. B.Sc. Biomedical Engineering, Northwestern University (Chicago). Leads strategy, business development, and financial management. Primary investor relations spokesperson. |
Recent Order Wins
| Recent Order Win | Value | Client |
| Consignment & Handling Agent | ₹81.51 Cr | SAIL (Bangalore) |
| WTG Erection — Wind Project | ₹24.14 Cr | JSW Energy |
| Specialized Services | ₹14.04 Cr | JK Cement |
| Transportation of Steel Products | ₹27.65 Cr | RINL |
Key Risks
| Risk | Assessment |
| Execution of Tarachand Metallix | New manufacturing business carries execution risk. Management has been appropriately cautious — no specifics committed yet. Monitor FY27 for clarity. |
| Receivables elongation | Receivable days ticked up to ~90 in Q3FY26 (from 75–82 days). Contract transitions in warehousing are the primary cause. Should normalise to <80 days by FY26 end. |
| Revenue concentration | SAIL and RINL are significant customers in warehousing. Loss of a major contract (as seen with RINL Vizag) can cause a sharp temporary revenue dip. |
| Capex execution risk | New equipment (especially large cranes) takes ~1 month from delivery to deployment. High capex in Q3FY26 (₹40 crore in December) means some revenue recognition push to Q4. |
| Depreciation drag | Heavy capex leads to high depreciation, suppressing PAT margins even as EBITDA grows. PAT margin of 7.5% in Q3 understates economic earnings — Cash PAT is a better metric. |
| Doubtful debts | ₹1.7 crore of doubtful debts from prior years was provisioned in Q3FY26, impacting revenue and margins. Legal action initiated. Unlikely to recur at this scale. |
| Private capex slowdown | Domestic construction equipment sales saw some softness in Q3FY26. However, the company’s order book and client relationships provide adequate near-term visibility. |
| Renewable energy margin compression | A listed competitor flagged margins in renewables EPC contracting compressing to 10–12%. Tara Chand clarified it does NOT do renewables EPC — only equipment rental in renewables — so this risk does not directly apply. |
This report does not constitute investment advice, a solicitation to buy or sell securities, or a recommendation of any kind. All forward-looking statements are subject to risks and uncertainties. Investors should conduct their own due diligence and consult a registered investment advisor before making any investment decisions.